

Academic Growth and Instructional Adjustments
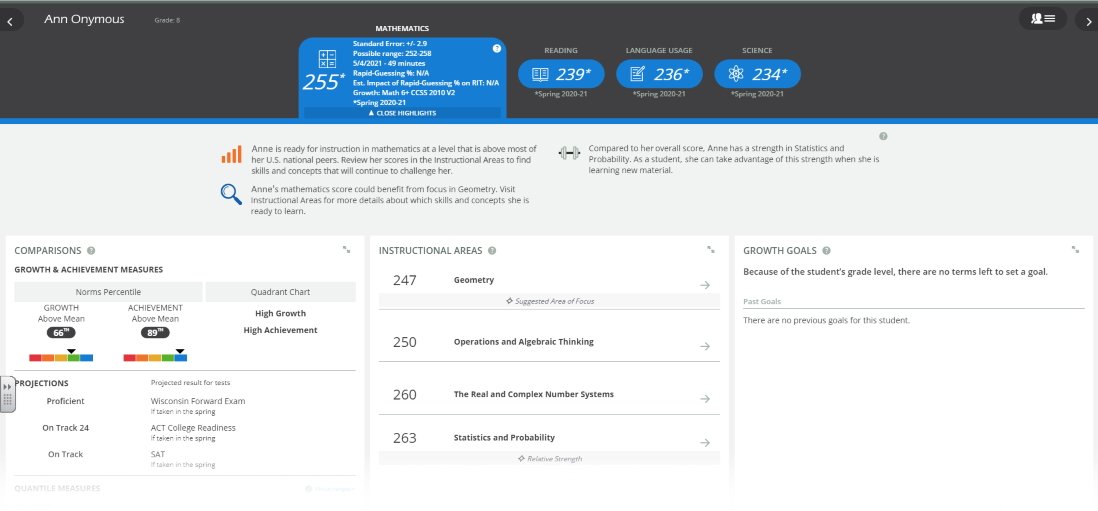
We have a testing program (MAP Growth) to determine a student's instructional level and to measure academic growth throughout the school year (and from year to year) in subjects like reading, math, language, and science. Unlike standardized tests, MAP Growth is administered three times during the school year, and it adjusts to each student’s performance, rather than asking all students the same questions.
The most valuable part of the results, however, is not just the score. MAP Growth gives quick feedback to teachers. They receive detailed reports to identify areas of weakness or strength, so they can plan instruction accordingly for each student. Teachers get:
a complete picture of each student's growth and performance
recommendations to help set learning goals and areas of focus
insights into what a student is ready to learn

Winter 2021
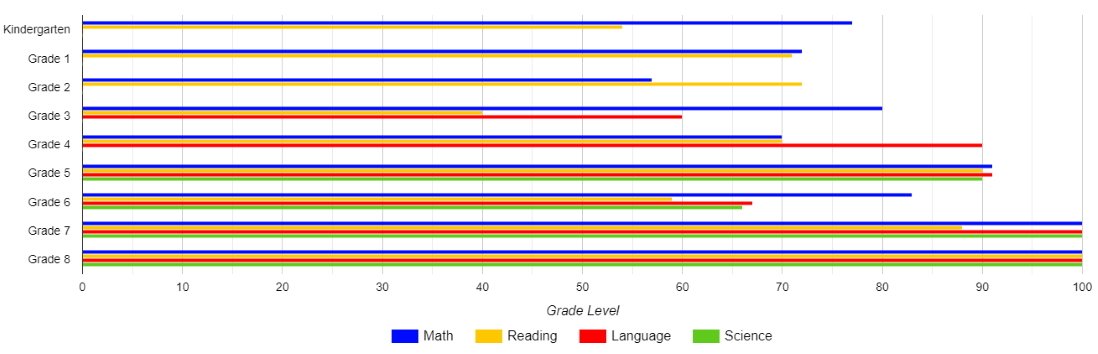
RESULTS - Percent of students average or above
The chart below shows the percentage of scores that are in the average, high-average, or high ranges nationally. Note that kindergarten through second grade take tests in math and reading. Students add the language tests when they reach third grade. Finally, science tests are added when they reach fifth grade.
| Kindergarten
Math - 69% average or above |
First Grade
Math - 71% average or above |
Second Grade
Math - 66% average or above |
| Third Grade
Math - 60% average or above |
Fourth Grade
Math - 66% average or above |
Fifth Grade
Math - 80% average or above |
| Sixth Grade
Math - 59% average or above |
Seventh Grade
Math - 100% average or above |
Eighth Grade
Math - 100% average or above |
Cumulative Growth
RESULTS
As you can see above, Zion has performed well overall. Typically, students who stay with our program continue to grow in their performance -- with notable results by the time they reach eighth grade.
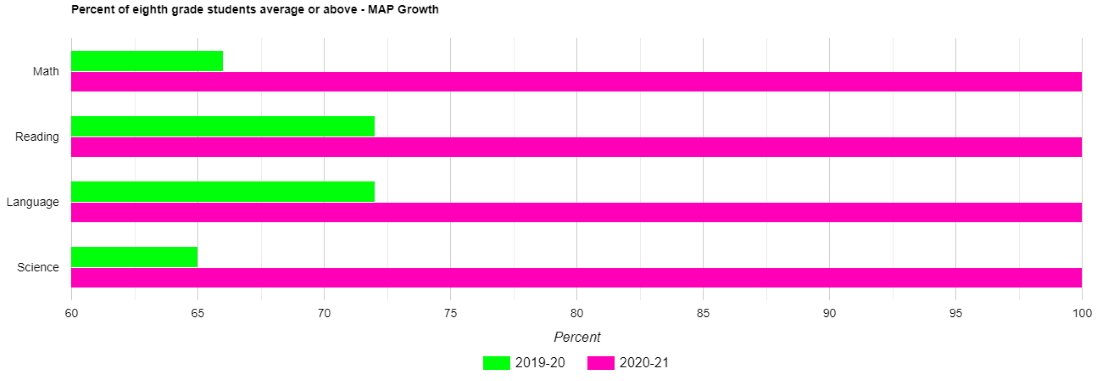
The chart below shows the percent of eighth grade students in the average, high-average, and high categories nationally from 2019-2020 and 2020-2021.
2019-2020 Eighth Grade Results
Math - 66% average or above
Reading - 72% average or above
Language - 72% average or above
Science - 65% average or above
2020-2021 Eighth Grade Results
Math - 100% average or above
Reading - 100% average or above
Language - 100% average or above
Science - 100% average or above
WKCE Results
Before we began using MAP Growth testing, Zion students participated in yearly standardized testing through WKCE. The charts below summarize the WKCE testing from the fall of 2010.
In 2010, we were able to run an apples-to-apples comparison of Zion to the Wisconsin average and to the public schools in our area. WKCE district data used for comparison charts was available to the public at the Wisconsin Department of Public Instruction website -- however, some private school data (including Zion) was not made available for public view at that site.
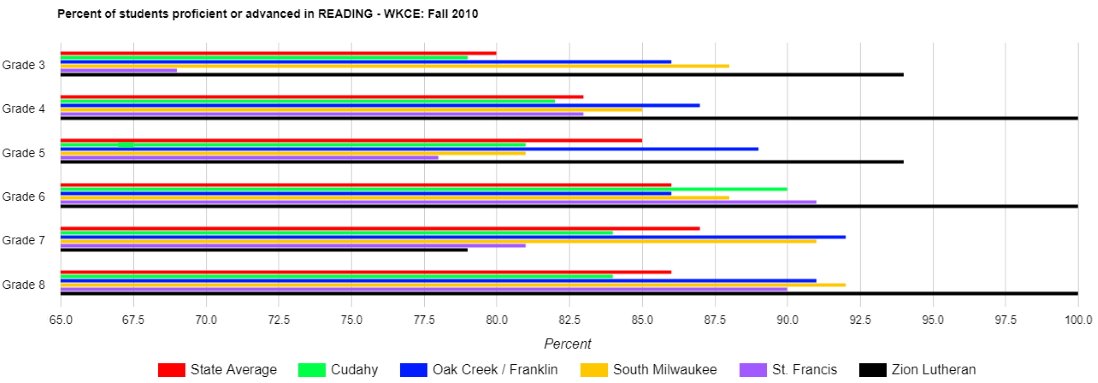
READING INFO FROM FALL 2010
The first chart shows the percent of students proficient or advanced in reading for grades 3-8. The top line (red) shows the state average. The green (Cudahy), blue (Oak Creek/Franklin), yellow (South Milwaukee), and purple (St. Francis) show the results from nearby schools. Finally, the black-colored line shows the results for Zion Lutheran.
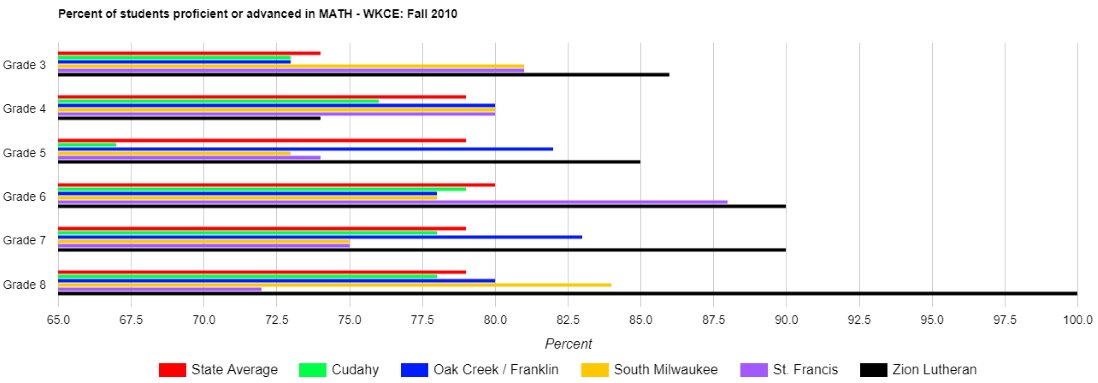
MATH INFO FROM FALL 2010
The second chart shows the percent of students proficient or advanced in math for grades 3-8. The top line (red) shows the state average. The green (Cudahy), blue (Oak Creek/Franklin), yellow (South Milwaukee), and purple (St. Francis) show the results from nearby schools. Finally, the black-colored line shows the results for Zion Lutheran.
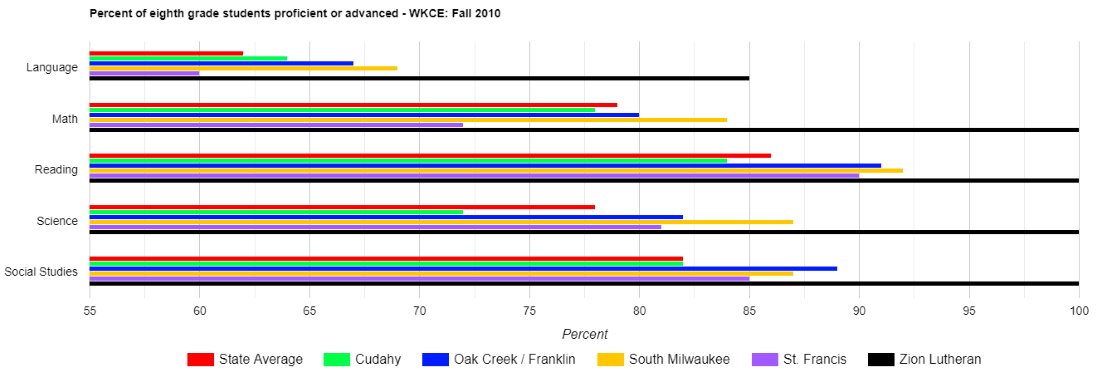
EIGHTH GRADE SUMMARY INFO FROM FALL 2010
The final chart chart shows the percent of students proficient or advanced in five subjects areas for grade 8: language, math, reading, science, and social studies. Results show that Zion had notable results. The eighth grade as a group scored highest in all categories against the comparison district group and achieved 100% proficient or advanced in 4 out of 5 subjects.
Again, the top line (red) shows the state average. The green (Cudahy), blue (Oak Creek/Franklin), yellow (South Milwaukee), and purple (St. Francis) show the results from nearby schools. Finally, the black-colored line shows the results for Zion Lutheran's eighth grade students.
HARD WORK AND COMMITMENT TO EXCELLENCE
A partnership of faculty, staff, students, and parents
For over 125 years, Zion Lutheran has placed a strong emphasis on Christian education. We offer classes for kindergarten through eighth grade, plus a daycare and preschool program.
We encourage you to find out more about Zion! Feel free to look around our webpage, contact us, and make an appointment to tour the school.